Originally published at: This week in charts: another rocky week for markets – InvestEngine Insights
It’s been quite a week for markets.
We began the week with markets recoiling from comments made by President Trump, who stated in a Fox News interview that he wasn’t dismissing the possibility of a recession, describing the current situation instead as a “period of transition.”
This week also brought further tariff news: on top of the tariffs currently in place on Canada, Mexico, and China, additional 25% tariffs are now also in place on all imports of aluminium and steel to the US, as well as a potential 200% tariff on European wine. It’s clear from the market’s swift reaction that it doesn’t view these tariffs as being favourable for the US’ economic outlook.
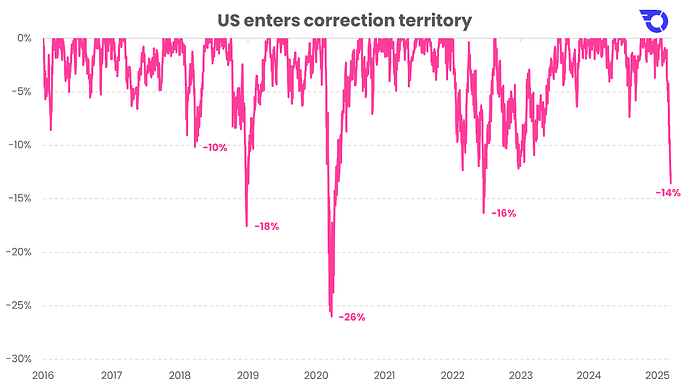
The US enters correction territory
Experiencing market downturns in real time feels uncomfortable for all investors, and the rapid pace of the current decline has only amplified its impact. Investors holding S&P trackers will see their portfolios down 14% from their highs only 3 weeks earlier:
*Source: Bloomberg. S&P 500 Total Return in GBP. Past performance is not indicative of future results.*
Making life more difficult for investors is the fact that market drawdowns never occur in a vacuum; they’re always accompanied by alarming headlines, which provide reasonable grounds for investors to worry. In hindsight, market drops look like easy buying opportunities – but they rarely feel that way when you’re in the midst of them.
Market declines are normal
The uncertainty and fear which come with a downturn can make it difficult to see the long-term potential, even when history suggests recovery is the norm. History actually suggests it’s completely normal for markets to experience declines of this size. In fact, the average drawdown investors can expect within a given year is 14%.
The chart below shows the average return over every calendar year since 1970 for the global stock market (blue bars), compared to the average market decline during that year (pink dots):
*Source: Bloomberg. MSCI World Total Return in GBP. Past performance is not indicative of future results.*
Despite the average intra-year drawdown (pink dots) being 14%, the average calendar year return (blue bars) is still a positive 12%. This means it’s normal for markets to have a 10-20% drawdown during the year, and still finish the year in firmly positive territory. Market drops aren’t the exception, they’re the norm – and they don’t mean the market won’t recover.
Based on this historical data, investors can expect roughly:
- A 10% drop every other year,
- A 20% drop in one in every five years, and
- A 30% drop every 10 years.
Improve your odds by staying invested
For investors worried about day-to-day market fluctuations, it’s important to remember that almost half of all trading days see the market fall. Looking back to 1970, 47% of all trading days have had negative returns.
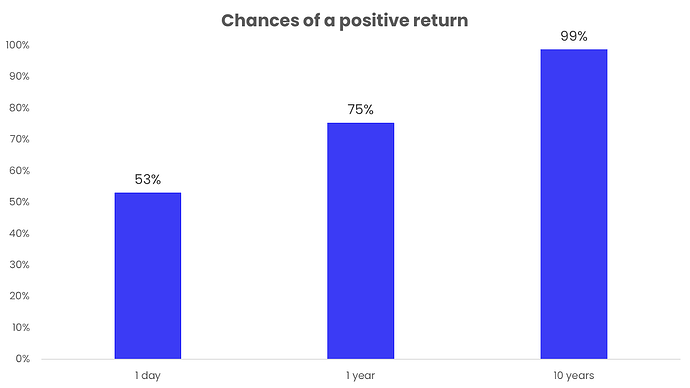
However, the longer you stay invested, the greater your chance of success:
- The market over a single day has historically offered a 53% chance of a positive return.
- Investing for a full year increases those odds to around 75%.
- Holding for a decade? The likelihood of a positive return jumps to 99%.
That means 99% of all 10-year periods going back to 1970 have seen positive returns for global equity investors.
*Source: Bloomberg. MSCI World Total Return in GBP since 1970. Past performance is not indicative of future results.*
Diversification pays off
Market volatility can be unsettling, so it’s a great time to revisit your personal comfort with investment risks. If recent market swings have left you uneasy about your investments, it could be a good time to revisit your risk tolerance.
Your portfolio’s asset allocation – the mix between riskier stocks and safer bonds – should match your personal goals and risk tolerance. If you’re feeling uncomfortable with the current market dip, it may be a sign you’re holding too much risk in your portfolio. A higher allocation to bonds may help you weather the storm against the inevitable larger future drawdowns.
The chart below shows the drawdowns investors would’ve experienced holding 100% global equities, versus those for investors holding a portfolio of 60% global equities and 40% bonds:
*Source: Bloomberg. Global equities are MSCI World Total Return in GBP, bonds are FTSE Actuaries UK Conventional Gilts up to 5 Years Index. Past performance is not indicative of future results.*
There are two interesting takeaways from the chart:
- The 9% drawdown this year for the global equity portfolio (pink line) is lower than the 14% experienced by the S&P. That’s because global equities are more diversified than just investing in the US. A global tracker holds stocks not only from the US, but from Europe, UK, and Emerging Markets too. Because Europe and Emerging Markets have outperformed the US this year (by quite a lot), a globally diversified equity portfolio is performing much better than a portfolio only invested in the US.
- Adding bonds greatly reduces the pain felt by equity losses. While long-term returns may be lower for bonds, if an allocation to bonds prevents an investor from being too worried about their portfolio and helps them stick with their portfolio when stock markets fall, then not only will they enjoy greater peace of mind, but their returns will be higher too. Investors who can stick with their strategy rather than reacting to short-term losses tend to achieve better long-term outcomes.
For those investors who are feeling uncomfortable with the losses they’ve been seeing in their portfolios, now might be a good time to reassess your risk tolerance and ensure your portfolio aligns with your comfort level and long-term goals.
Zooming out
During periods like this, it’s always helpful to zoom out and take a longer-term view. For investors who have held through the last 10 years, and managed to sit through the multiple 10%+ drops, they will have been rewarded for their forbearance. £100 invested 10 years ago has grown to almost £300 today:
*Source: Bloomberg. MSCI World Total Return in GBP. Past performance is not indicative of future results.*
While short-term volatility can be challenging, history suggests that staying the course has been a winning strategy for long-term investors.
Important information
Capital at risk. The value of your portfolio with InvestEngine can go down as well as up and you may get back less than you invest. ETF costs also apply.
This communication is provided for general information only and should not be construed as advice. If in doubt you may wish to consult a professional adviser for guidance.
Tax treatment depends on personal circumstances and is subject to change, and past performance is not a reliable indicator of future returns.


